
Understanding plugin report
For better organization, all plugins of the same test code are grouped together. When you open a plugin report and click on a test code, you get to see the related plugins that are run for that target
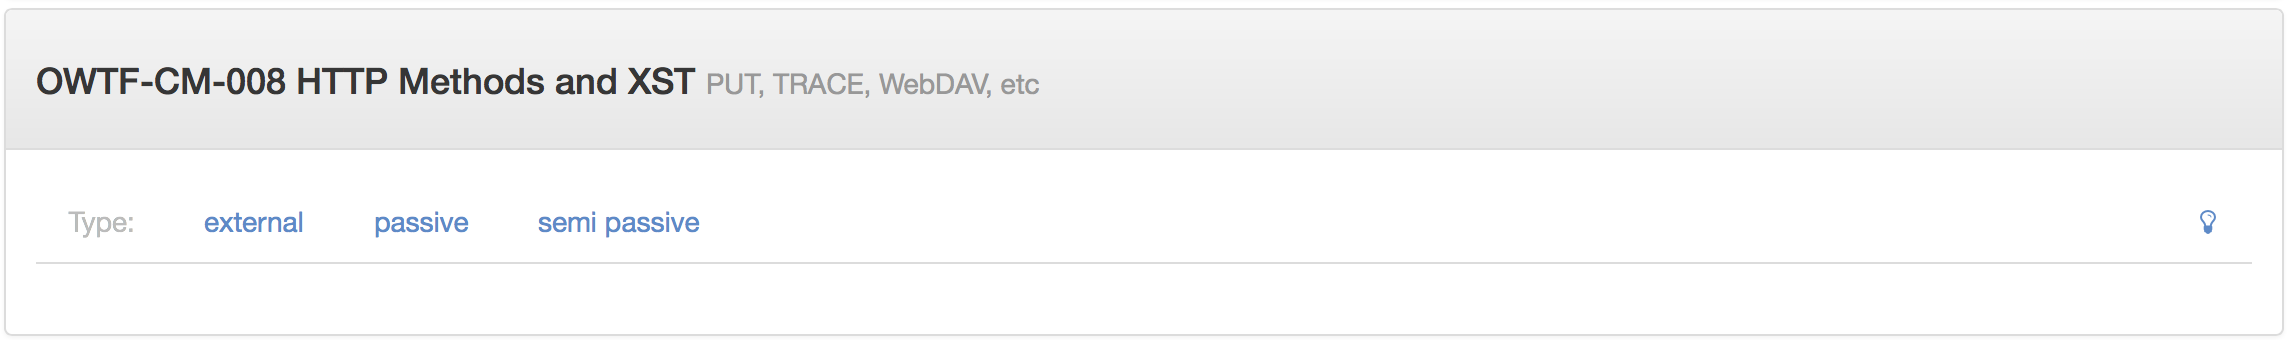
Each test group has an expandable report. The text of the link consists of there parts
- Code of the test group as per the mapping (Eg: OWTF-CM-008)
- Name of the test group as per the mapping (Eg: HTTP Methods and XST)
- Pentester translations for the code (Eg: PUT,TRACE, WebDAV etc..)
Now if you proceed to select a plugin type, you can see the corresponding report
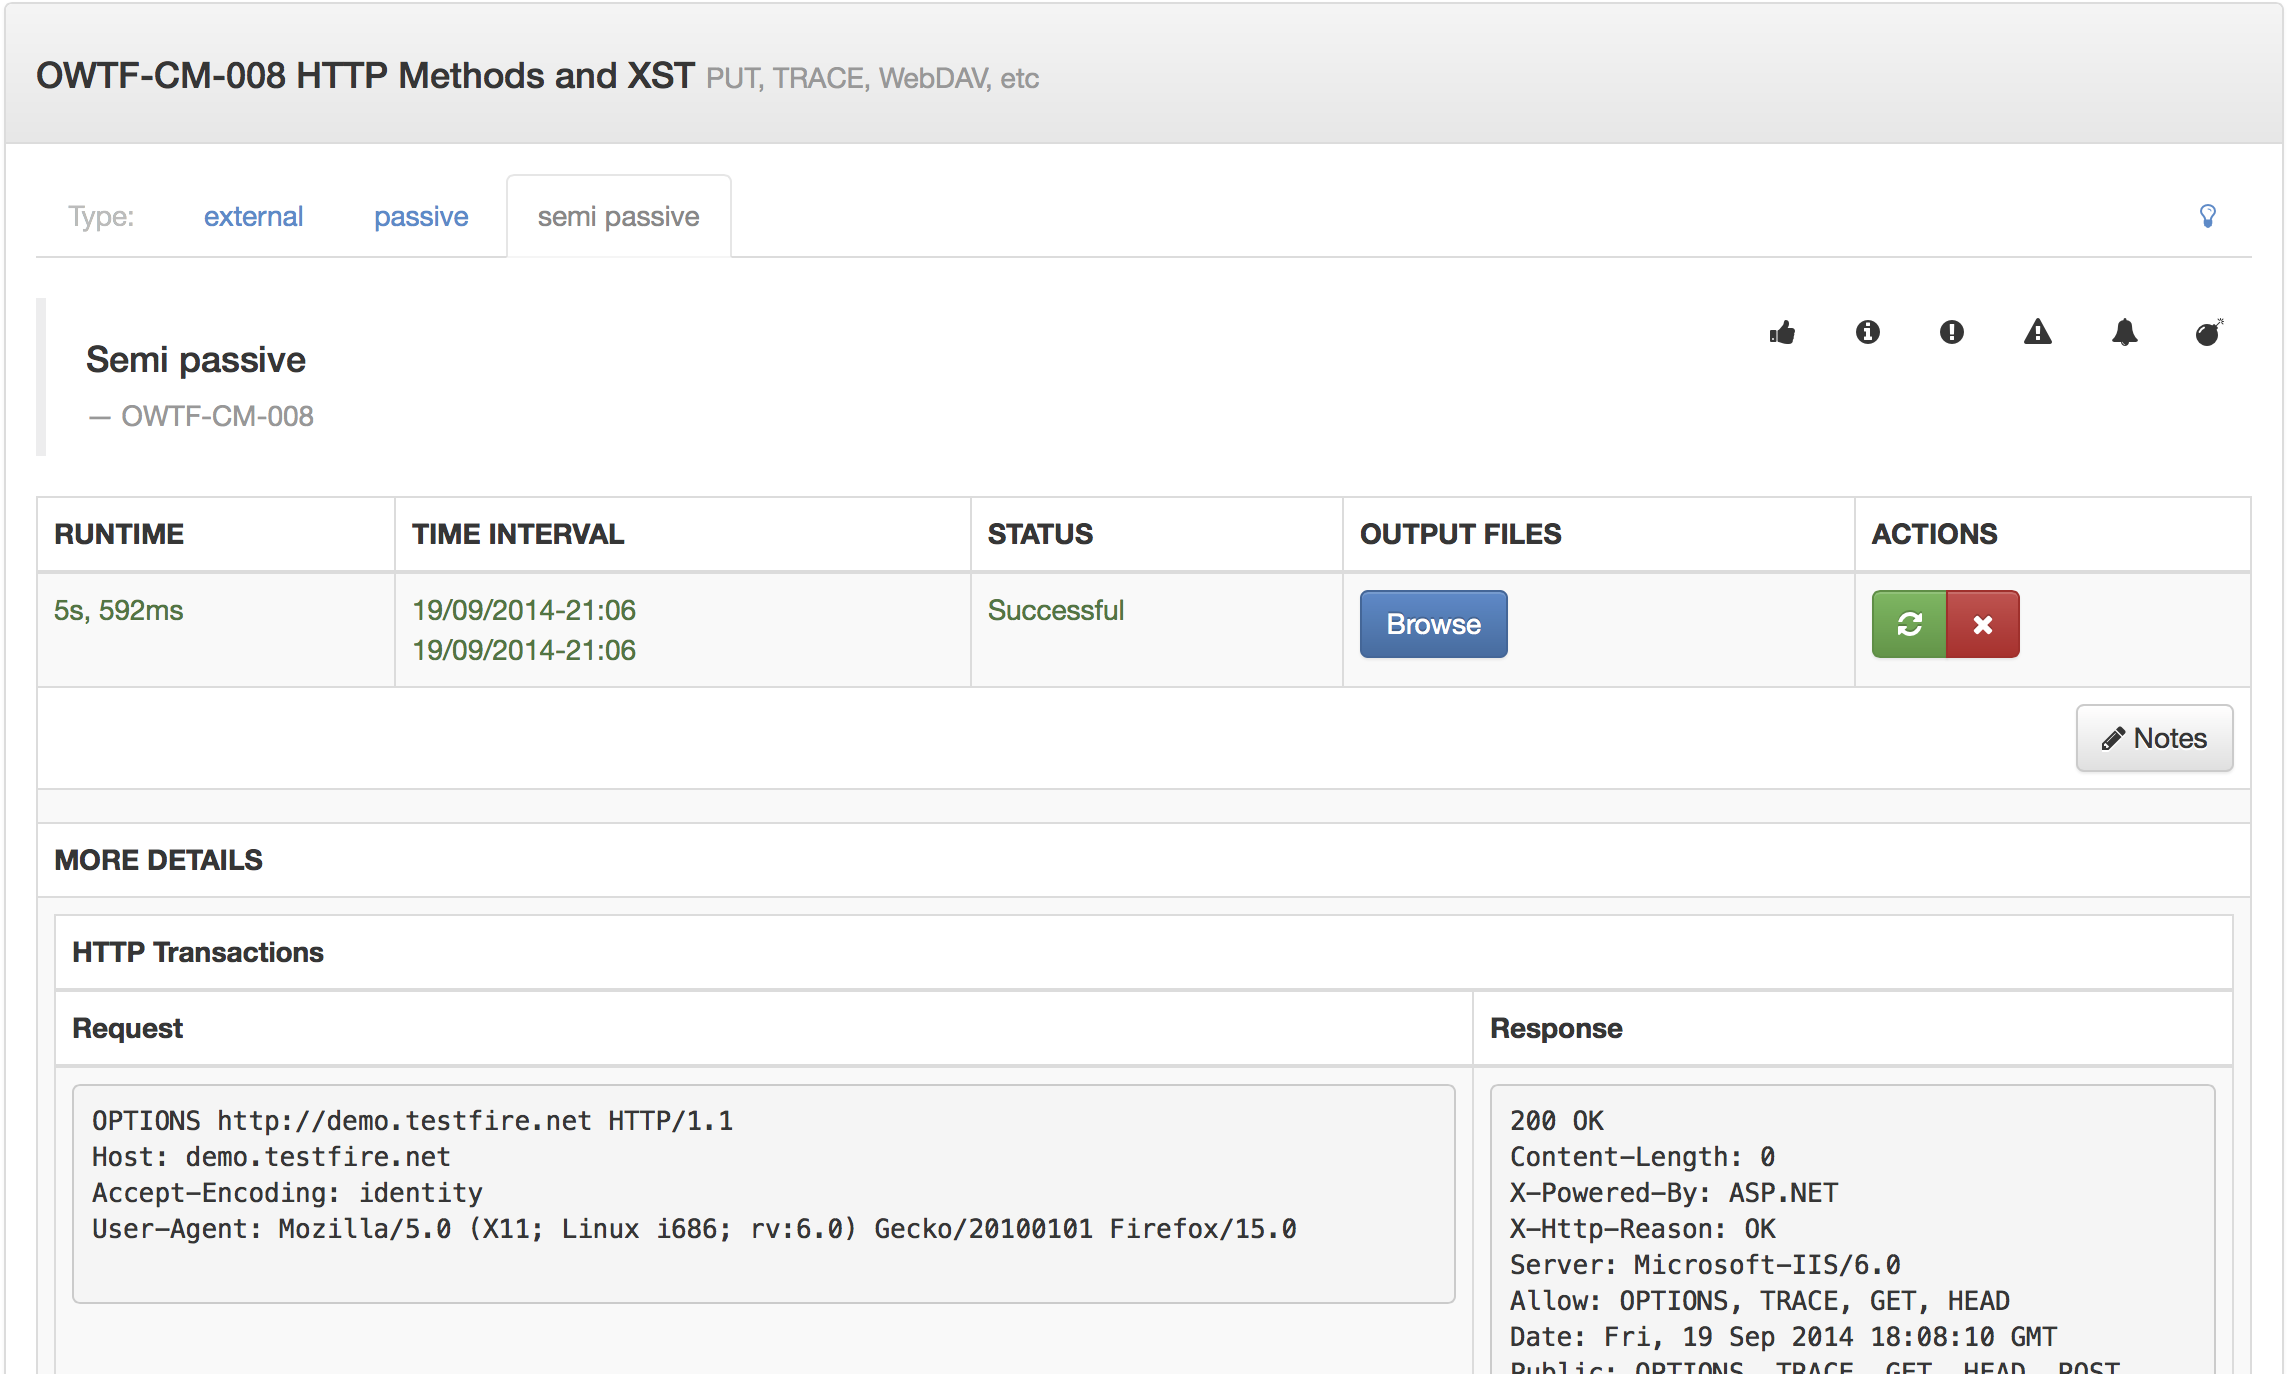
The details presented in a plugin report are:
- Run time of the plugin
- Time interval during which it was running
- Status of the plugin (i.e if it was aborted by user etc..)
- A button to rerun the plugin
- A button to delete the plugin output
- A button to add notes
- Actual plugin output
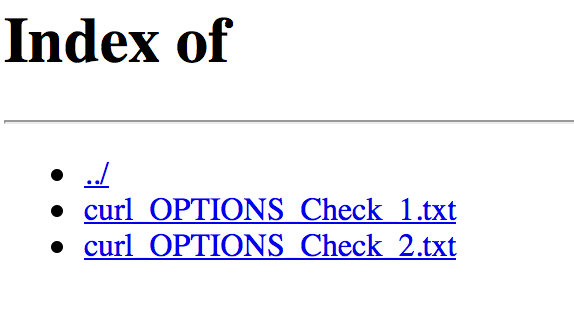
If you click on the Browse button, then any file saved by the plugin can be seen
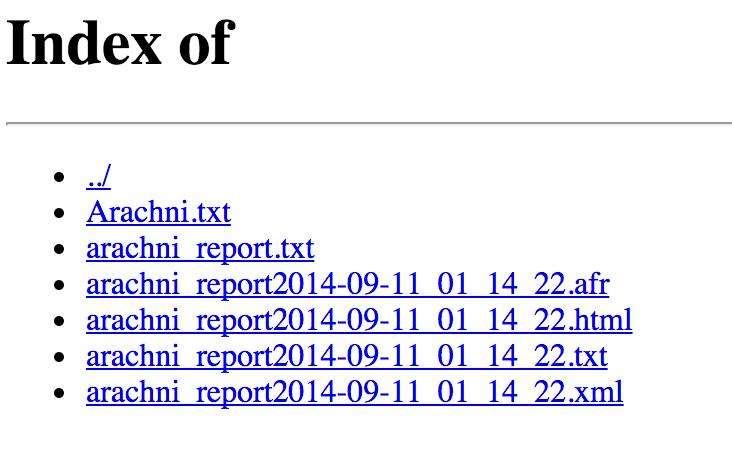
Files of Arachni active plugin